

Graphing linear equations might sound intimidating, but it’s a fundamental concept in algebra and an essential tool in mathematics. Luckily, with the right guidance (and a few visuals), learning how to graph is easier—and more exciting—than you might think!
What Is a Linear Equation?

A linear equation is a mathematical statement that forms a straight line when graphed on a coordinate plane. It typically looks like this:
Here’s a quick breakdown:
- y and x are variables (coordinates on the graph).
- m represents the slope (the steepness of the line).
- b is the y-intercept (where the line crosses the y-axis).
Linear equations describe relationships between two variables, and their graphs visually show how one variable changes in response to the other.
Why Graphing Linear Equations Matters
Graphs turn math into visuals we can interpret at a glance. When you graph a linear equation:
- You can quickly see the relationship between two variables.
- It’s easier to predict outcomes or analyze trends.
- Graphs play a crucial role in fields ranging from science to business—you’ll use these skills in the real world!
If you want to dig deeper into understanding algebraic principles like this, explore the resources offered by Khan Academy’s lessons on linear equations.
Steps to Graph a Linear Equation
Step 1: Understand the Equation y = mx + b
This form is known as the slope-intercept form, and it’s the easiest way to start graphing. The two key components are:
- Slope (m): The “rise over run,” or how steep the line is.
- Y-intercept (b): Where the line crosses the y-axis (at x = 0).
Step 2: Plot the Y-Intercept
Start by finding the y-intercept. This is the point where the line meets the y-axis. For example, in the equation y = 2x + 3, the y-intercept is 3. Mark the point (0, 3) on your graph.

Tip: Use Desmos’s online graphing tool to practice plotting points like (0,3). This interactive tool makes it easy to visualize the slope and y-intercept, helping you understand how changes to m and b affect the graph.
Step 3: Use the Slope to Find the Next Points
The slope tells you how to move from the y-intercept. If the slope is m = 2, you move up 2 units (rise) and 1 unit to the right (run). Plot the next point and continue the process.
To extend your line into the negative side of the graph, you can use the slope in reverse. For instance, if the slope is m=2 (rise of 2 and run of 1), move down 2 units and 1 unit to the left instead. Plot these points to expand the line in the opposite direction. This ensures your line is complete and accurately represents the equation across both positive and negative values of x.

Tip for Beginners: If the slope is negative, it means the line slants downward. For example, if , you move down 2 units and 3 units to the right.
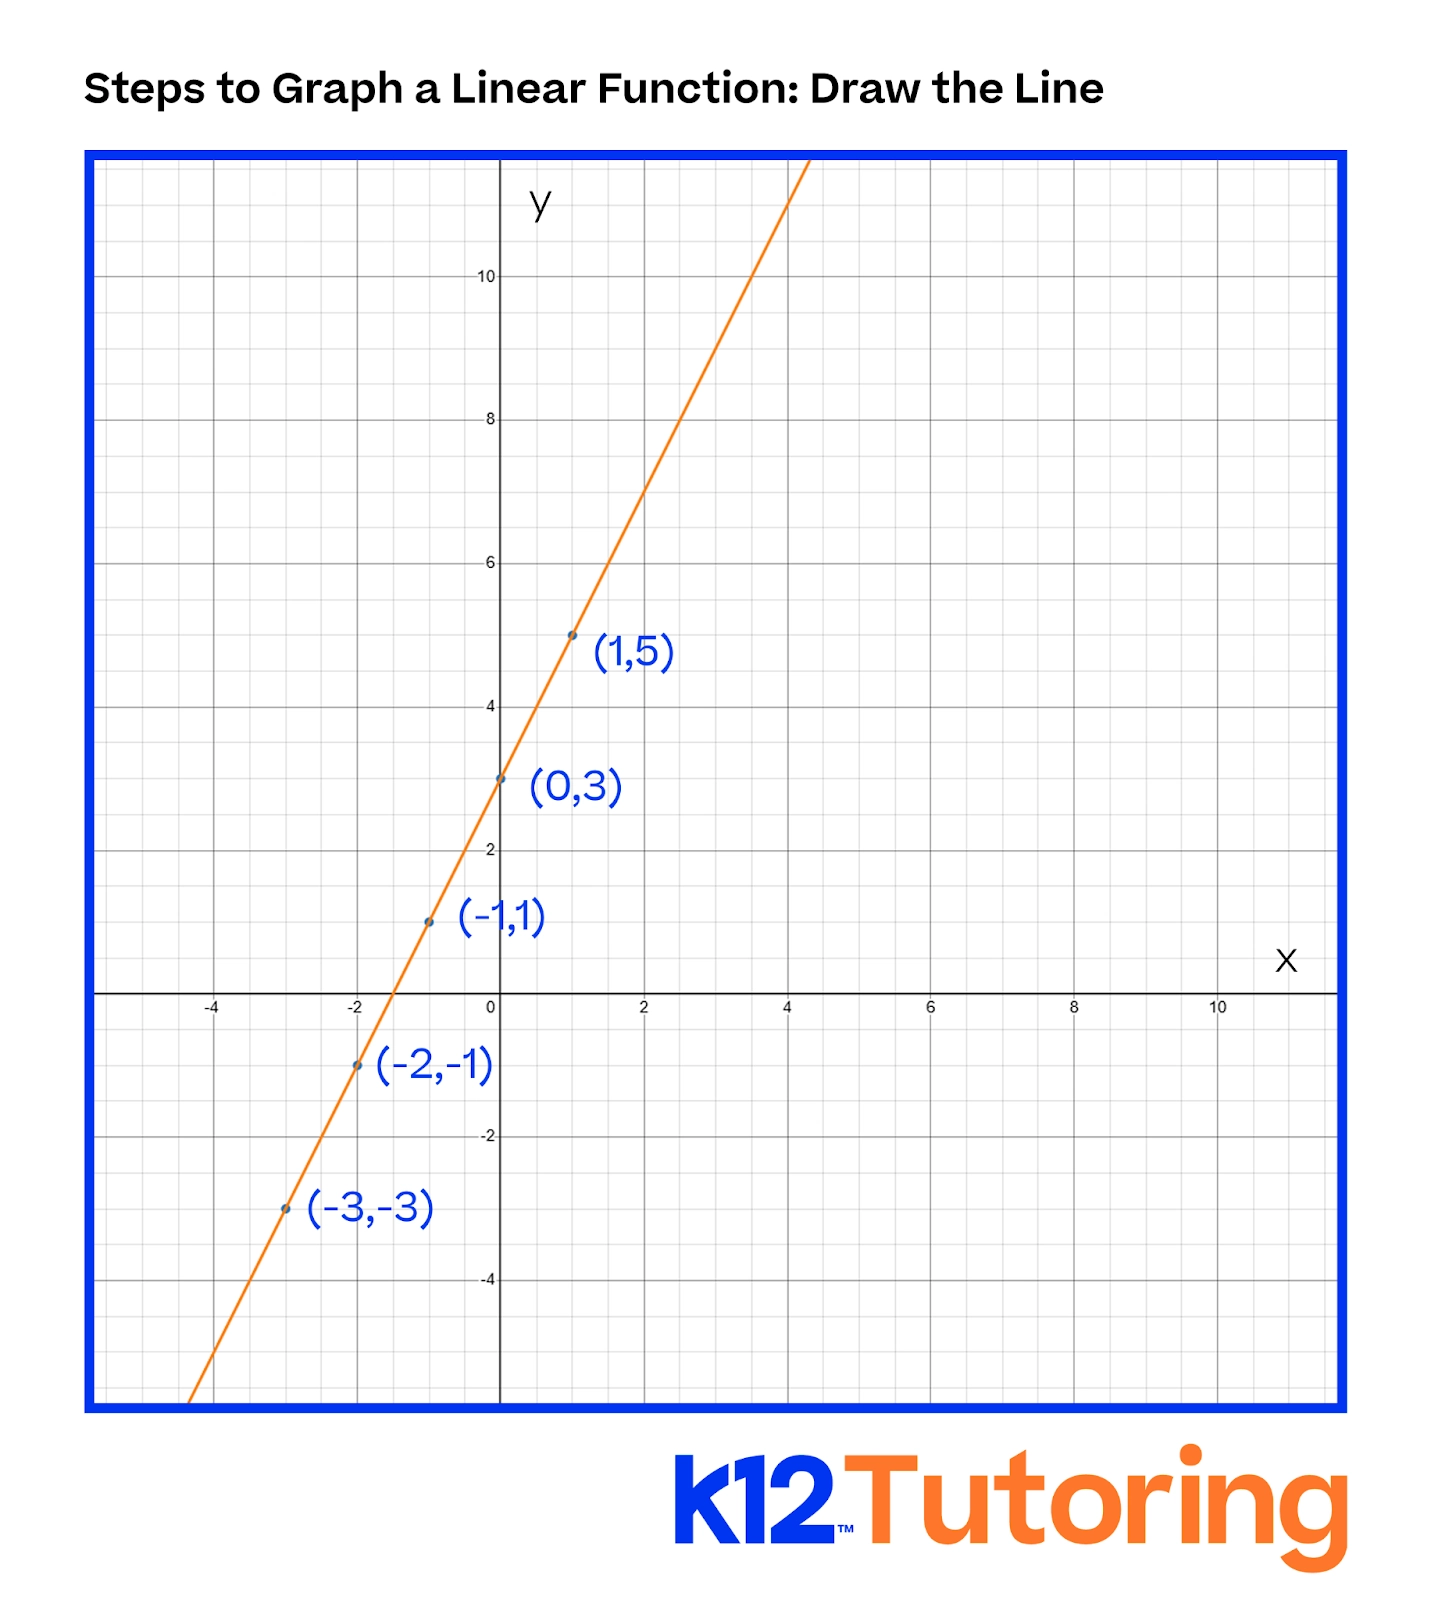
Step 4: Draw the Line
Once you have two or more points plotted, use a ruler to connect them. Voila! You’ve graphed your linear equation.
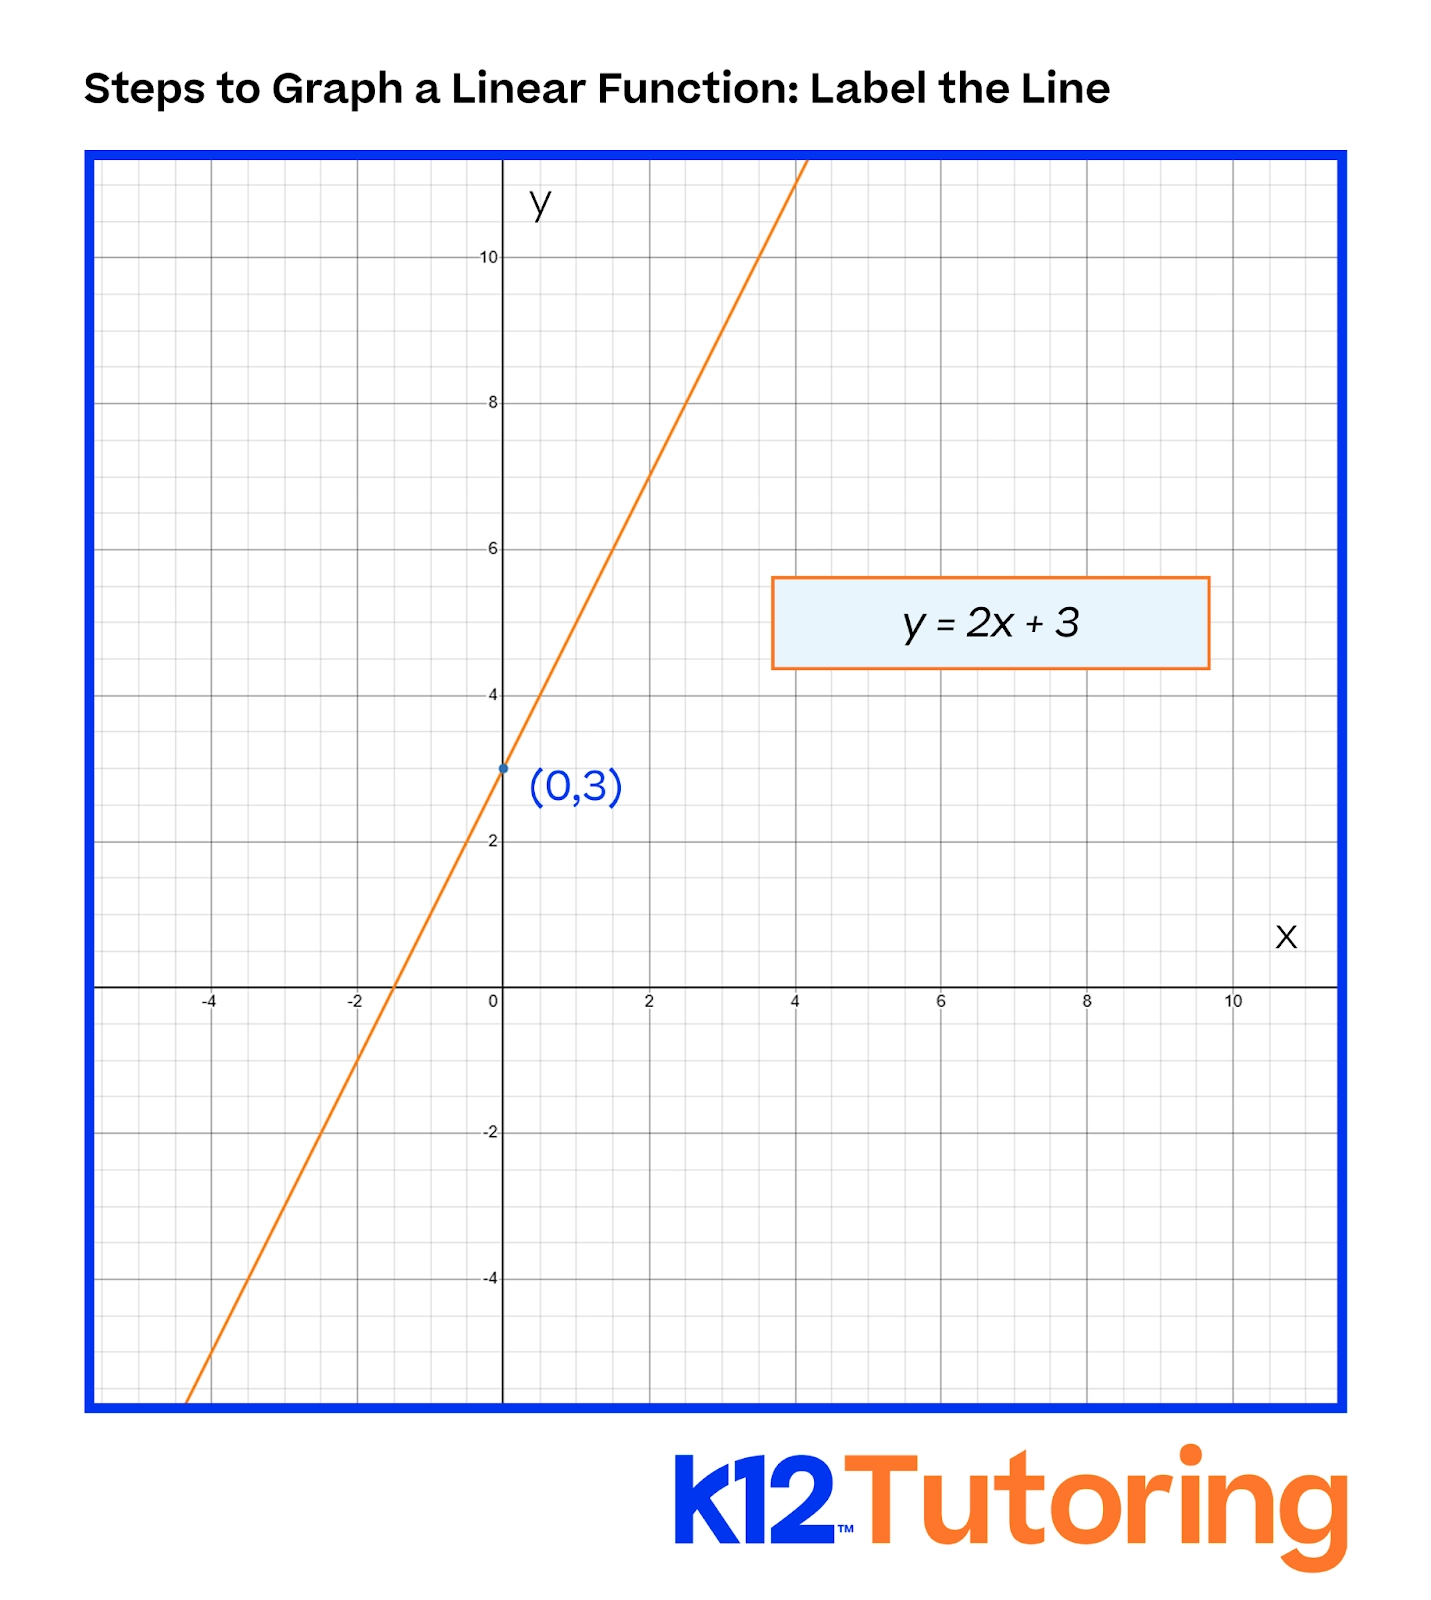
Step 5: Label the Line
Don’t forget to label your graph. Include the equation of the line and mark axes clearly to avoid confusion.
Example Problems:
1. Graph y = 3x + 1
- Y-intercept is 1, so start at (0,1).
- Slope is 3, meaning a rise of 3 and a run of 1.
- Connect the points to graph the line.

2. Graph y = -2x – 4
- Y-intercept is -4, so start at (0, -4).
- Slope is -2, meaning move down 2 units and 1 unit to the right.
- Connect points with a straight line.

Challenge Yourself:
Try graphing these on your own:
- y = x + 2
- y = -3x + 5
Common Mistakes (And How to Avoid Them)
- Misinterpreting slope: Remember, slope is always rise over run. Double-check your movements on the graph.
- Forgetting the y-intercept: Always start at the y-intercept. It’s your graph’s anchor.
- Not extending the line: Your line should stretch across the graph, not stop after two points.
Real-World Applications
Graphing linear equations isn’t just an abstract math skill. It appears in:
- Business: To calculate profit trends or growth projections.
- Science: To map relationships between variables, like speed vs. time.
- Everyday Life: Budgeting scenarios, such as comparing price per mile for car rental companies.
Understanding how to graph linear equations ensures you’re equipped to connect the dots—literally and figuratively—in these scenarios.
Start Mastering Algebra Today
Graphing linear equations is your gateway to understanding deeper algebraic concepts. With a straightforward approach and practice, anyone can master this skill.
Want to sharpen your algebra skills even more? Check out K12 Tutoring’s Algebra Tutor Services for one-on-one guidance and interactive practice. Learning with an experienced tutor can make a big difference in mastering equations like these.
Also, take a look at our article, How to Find the Y-Intercept of a Line: Simple Steps for quick and easy tips to boost your understanding of graphing lines and intercepts!


